At LCLS the thing that most often goes wrong is an RF station, one of the stations that accelerate the electron beam. When one of them changes, the electron energy changes with it, and so do the x-rays (sometimes beam delivery just stops). So every time a station does something odd, you want to know whether it reached the beam. The group had already built detectors for that by hand (PRAB 2022, a paper I'm not on). They worked. But they took a lot of effort and manual inspection, and they needed labels, which are rare. Coincident learning for anomaly detection (CoAD) needs no hand-built detector and no labels. The method is Ryan Humble's (he was at Stanford), and so are the proofs and the writing. I benchmarked CoAD and applied it to the LCLS RF/BPM data and to MNIST (and cleaned up its API along the way), and that put me second of five authors on the paper.
- 0.86F1 on LCLS RF-station faults, with the detectors trained without labels
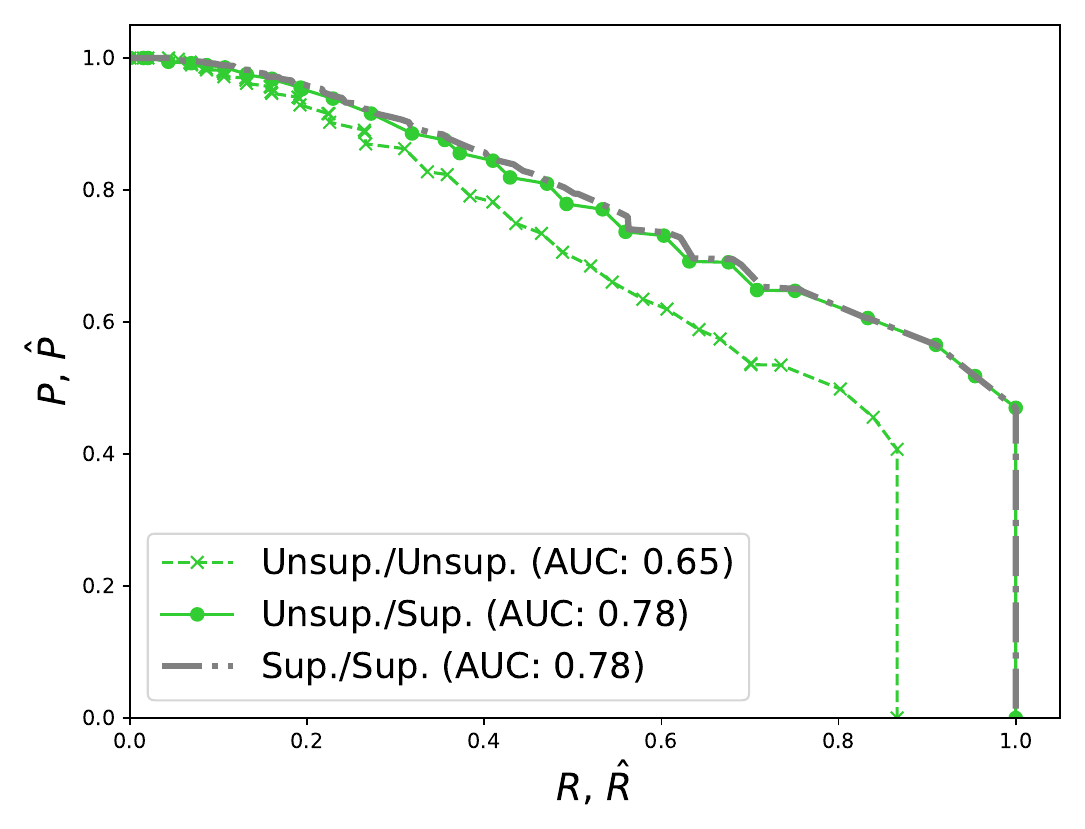
- 0.78P-R AUC on synthetic data with thresholds picked without labels, the same as picking them with labels
- 99.2%or more of every MNIST anomaly class caught at
Two inputs, one fault
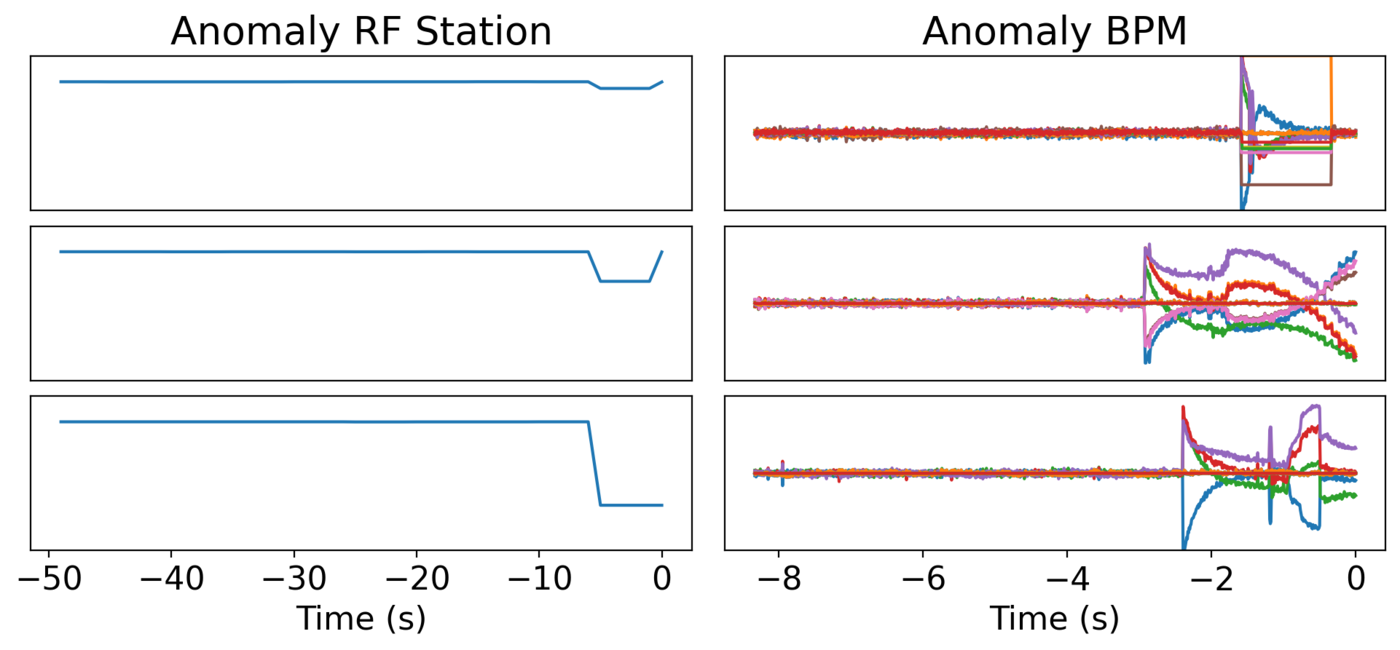
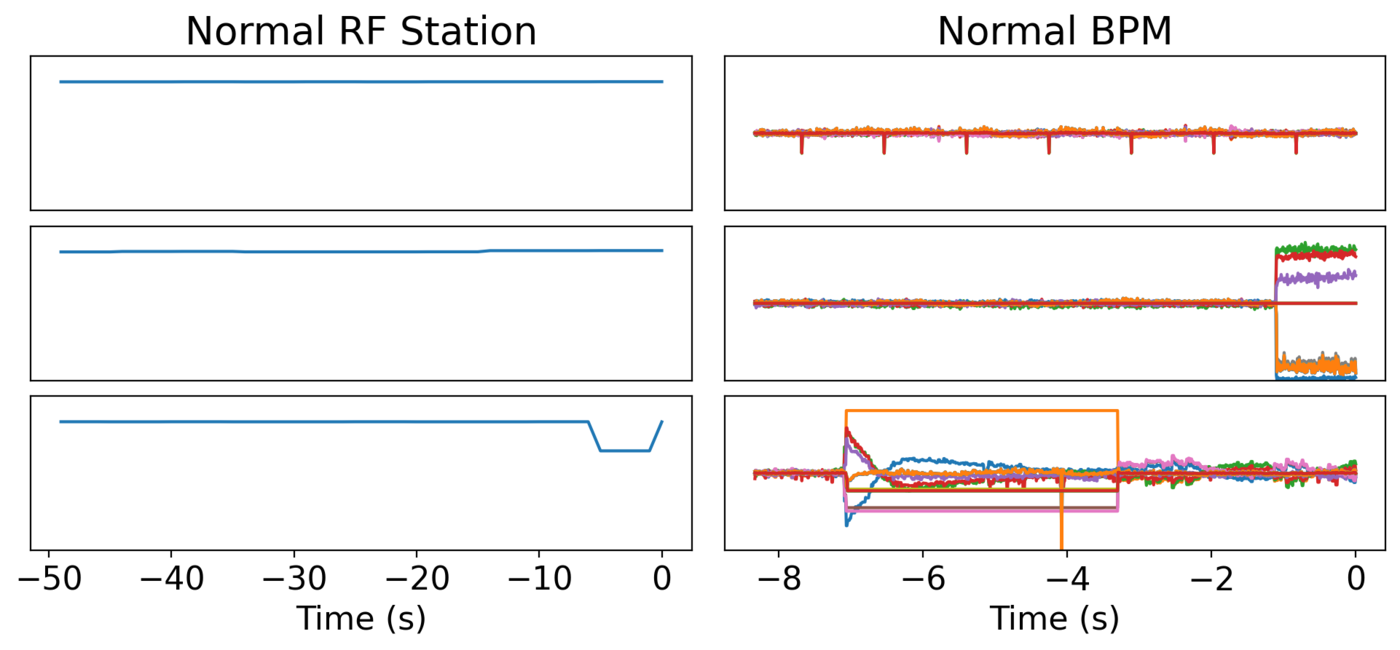
Say you have two sets of measurements of the same event. For LCLS that is the station's own signal (call it ) and the beam position monitors that see the electron energy (). In normal running their wiggles have nothing to do with each other. A real fault shows in both. So give each input its own detector, and only count an event when both fire at once.
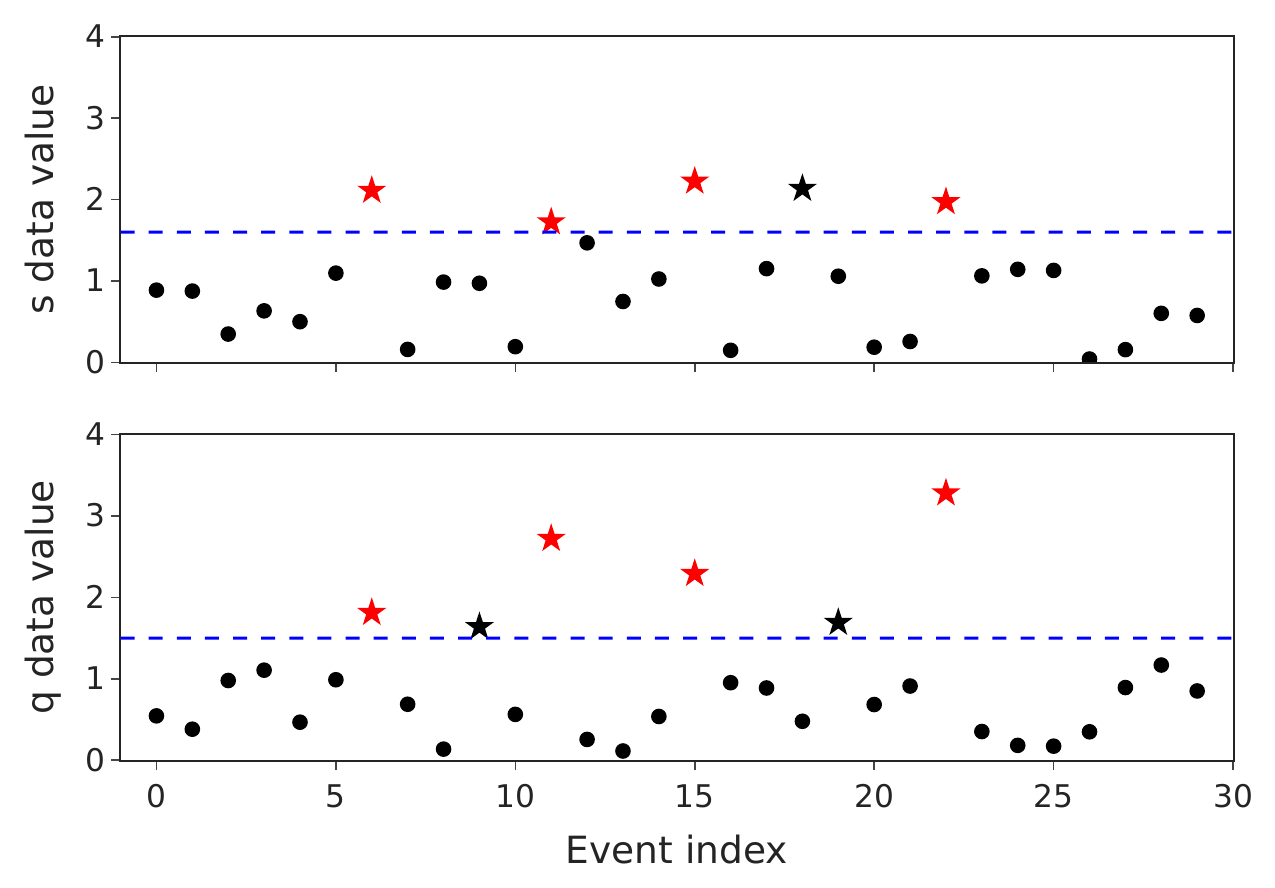
Some joint events are false alarms. Without labels you can't count them directly. What you can do is take the events the detector calls normal and see how often the detector fires anyway.
and are what the two detectors call each event, and means the detector called it normal.
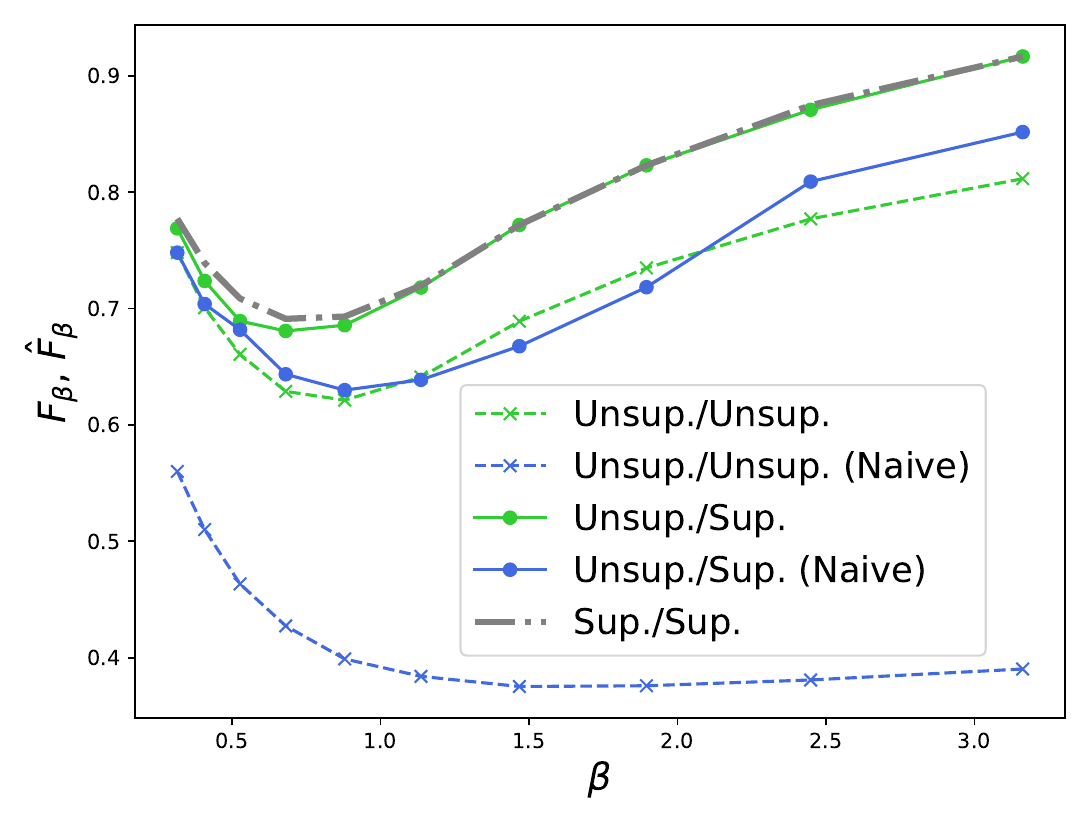
That product, , can only overestimate the false alarms, as long as the inputs are independent once you know whether the event is a fault, and neither detector is worse than guessing at random. Put it where the false alarms go in the usual F-score. That gives a score that needs no labels and never comes out above the real one.
is the share of events both detectors flag, the anomaly fraction in the data, and the weight between precision and recall.
only ever shows up multiplied by , so a wrong guess at the anomaly fraction just means you picked a different . Anomalies do have to be the minority, and training holds the detectors to that. The paper uses the score two ways. Given two detectors you already have, it picks their thresholds. Or it is the loss for training two small networks from scratch, one per input, and it also decides when to stop and which run to keep.
One RF station and seven BPMs
The LCLS data came from that 2022 work. The input is one RF station's signal, with a window cut whenever it moves by 0.5%. The input is seven BPMs in dispersive (energy-sensitive) spots along the machine, read over the last several seconds before each station event ends. Two small 1-D convolutional networks, one for each input, trained on it. Only came from the labels. (It is the rough anomaly rate, about one event in five.)
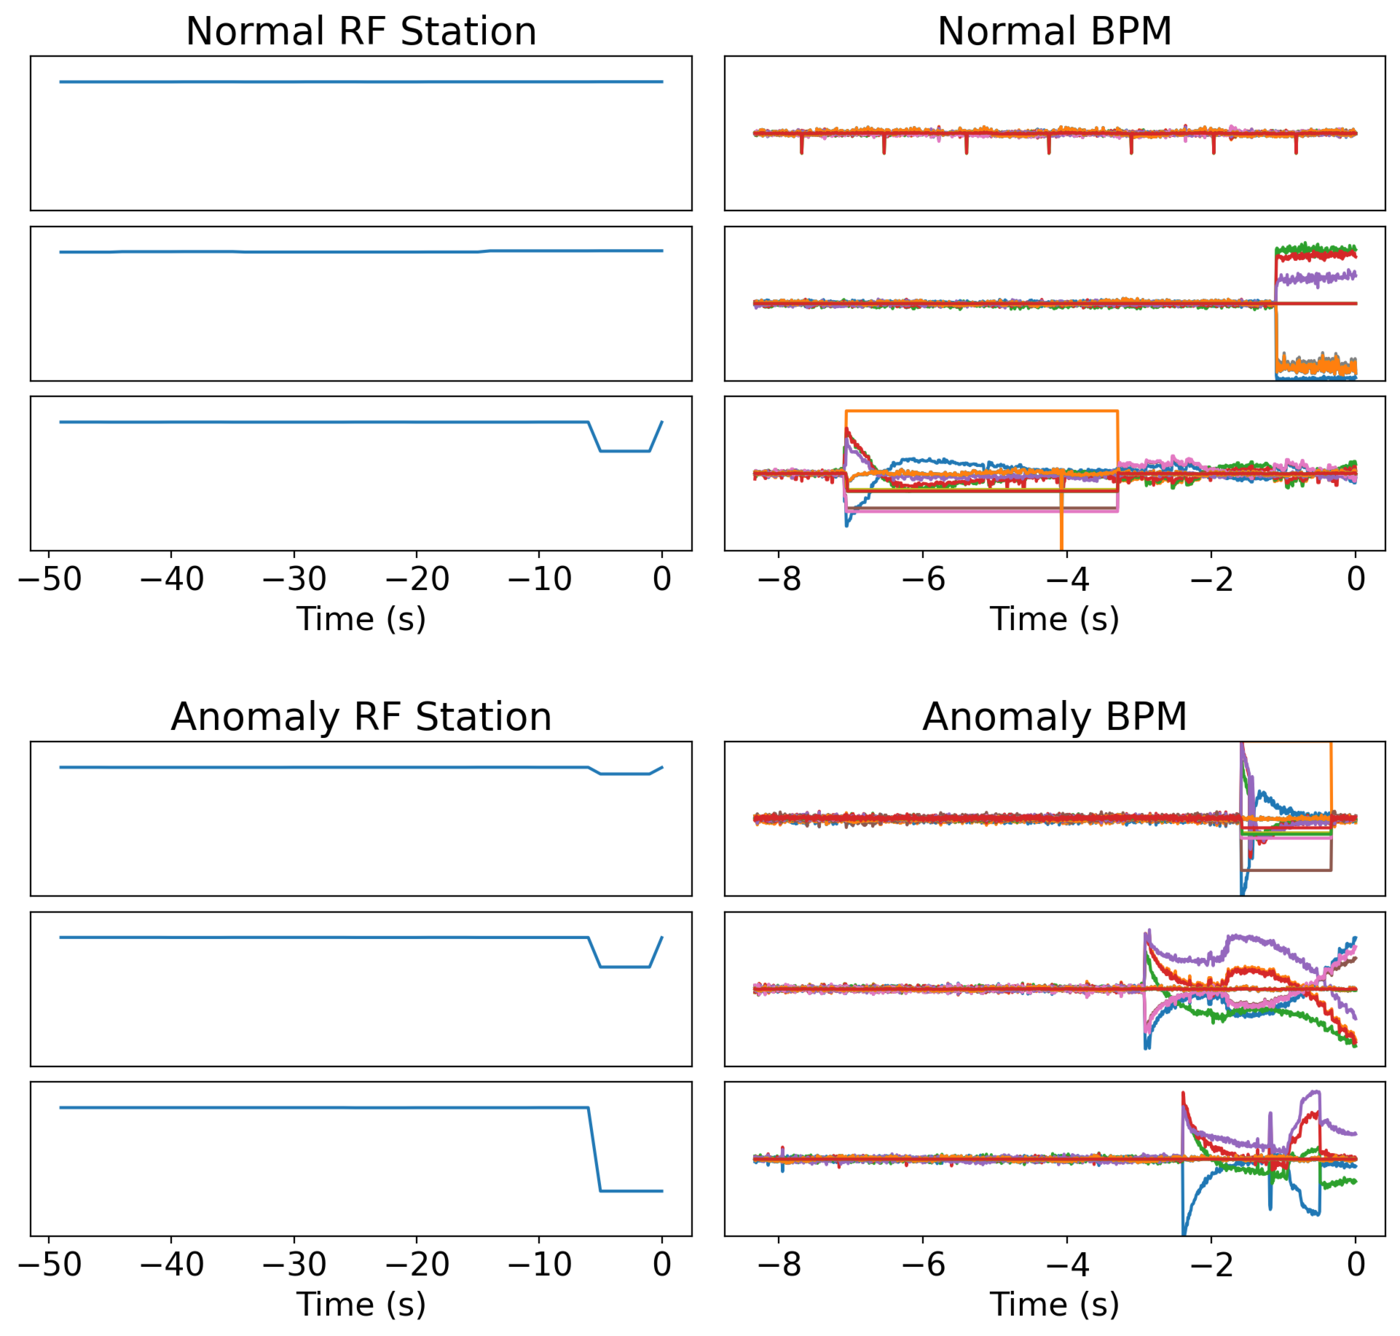
Against the hand labels, by F1:
| Method | Needs labels | F1 |
|---|---|---|
| Expert detector (PRAB 2022) | yes | 0.90 |
| Supervised network (PRAB 2022) | yes | 0.88 |
| OCSVM | no | 0.66 |
| DGHL | no | 0.64 |
| OmniAnomaly, on a reduced training set | no | 0.80 |
| Correlation or covariance loss | no | 0.82 |
| CoAD | no | 0.86 |
OmniAnomaly's public code ran out of GPU memory, so it got less data to train on. The row above CoAD is closest. It uses CoAD's own networks and training and only swaps the loss for the ones from DCCA and DMCA. So CoAD came out ahead of every other unsupervised method and a little behind the expert detector, a gap the paper puts "within the expected error rate of the hand labels".
Digits, and what β does
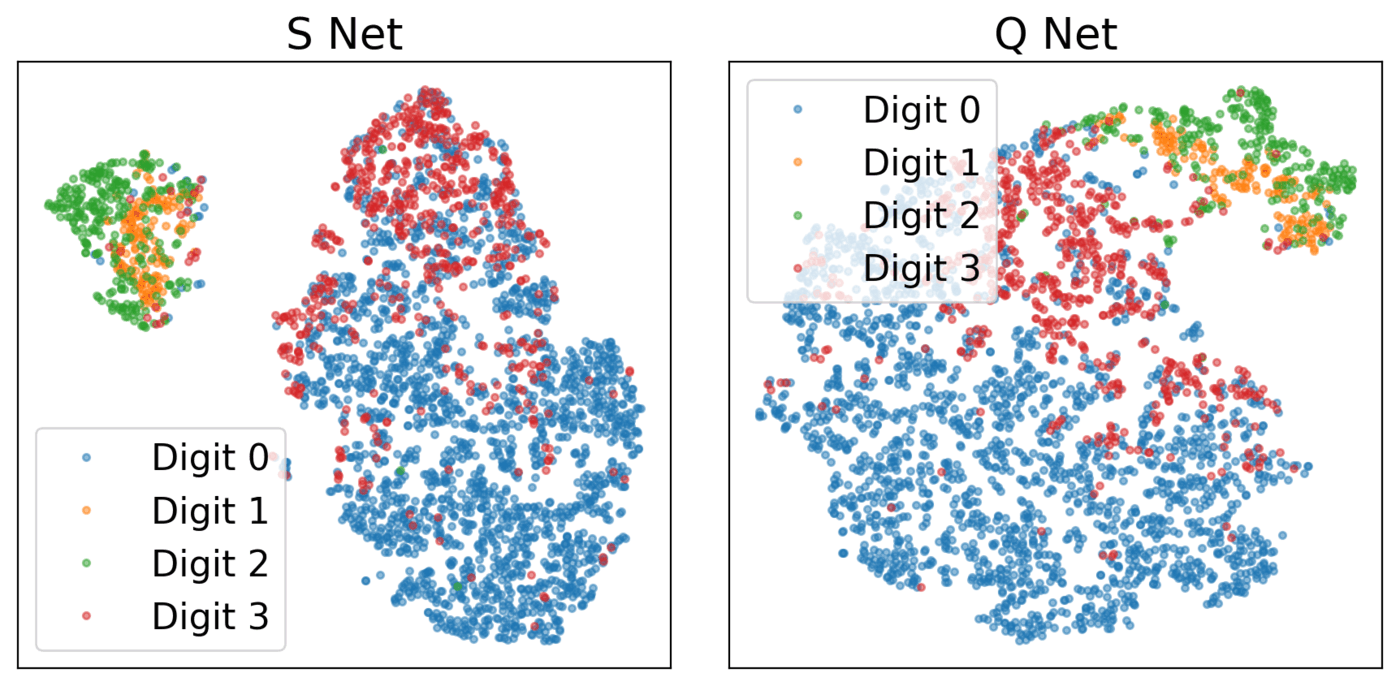
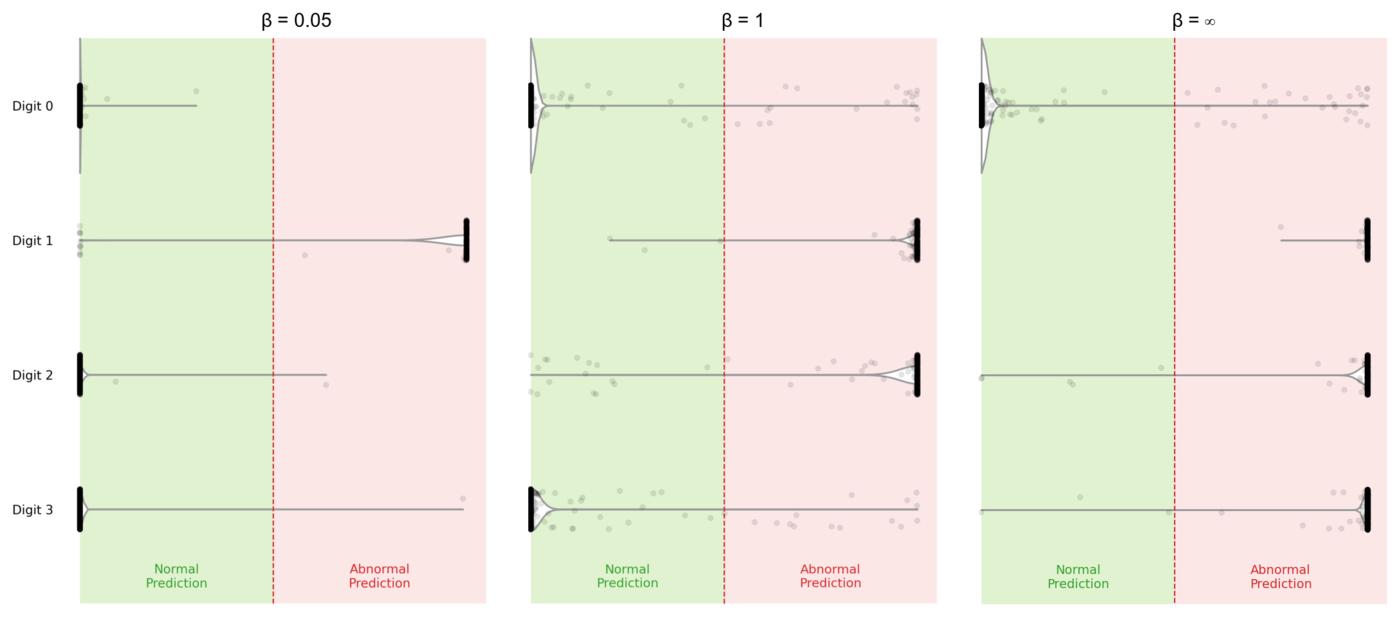
MNIST was the test where we knew the answer. Each example is a pair of images, one for each network. Normal is two 0s. An anomaly is two of the same digit, a 1, a 2 or a 3. Noise swaps an image between that digit and a 0, at a different rate for each class. The 1s are never swapped, and the 3s get swapped four times as often as the 2s (one image in five). A pair counts as flagged when the product of the two outputs is over 0.5.
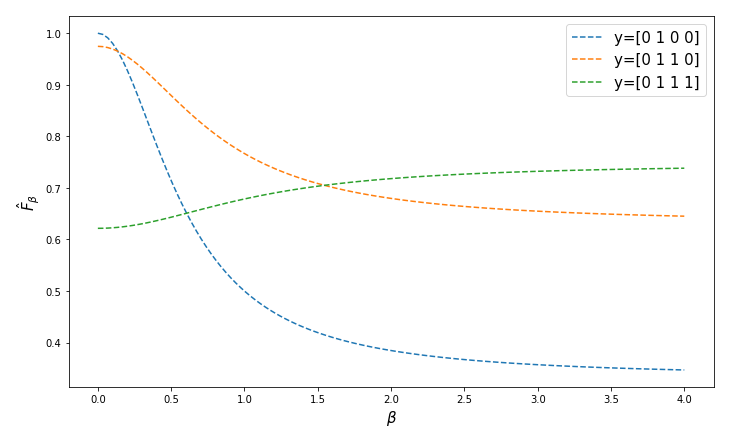
is the knob. It decides how much noise an anomaly can carry and still count. At it caught only the clean 1s (96.3% of them), with no false alarms at all. Raising to 1 brought in the 2s but still left the 3s alone, and the 0s picked up 0.5% false alarms. With pushed all the way to the 3s came in too, for no more false alarms than that.
Milling cuts
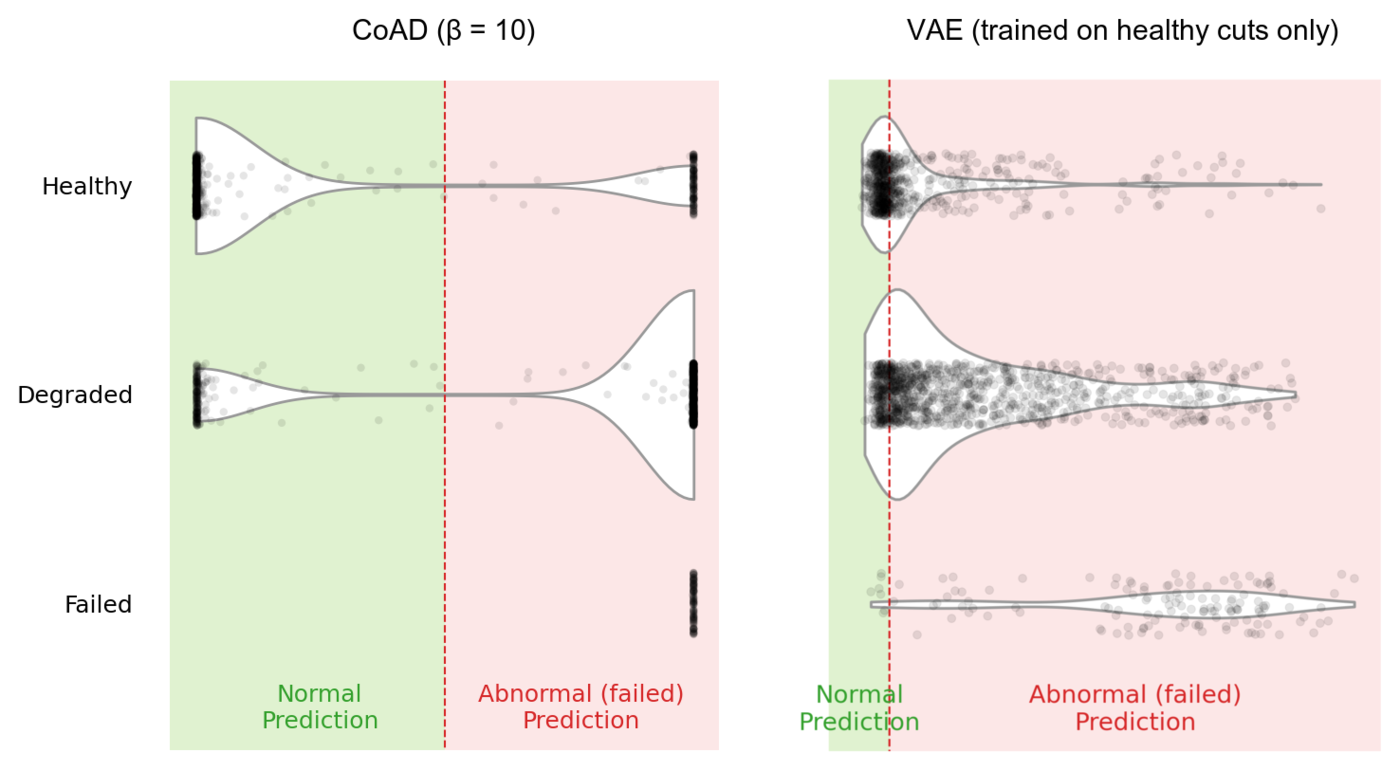
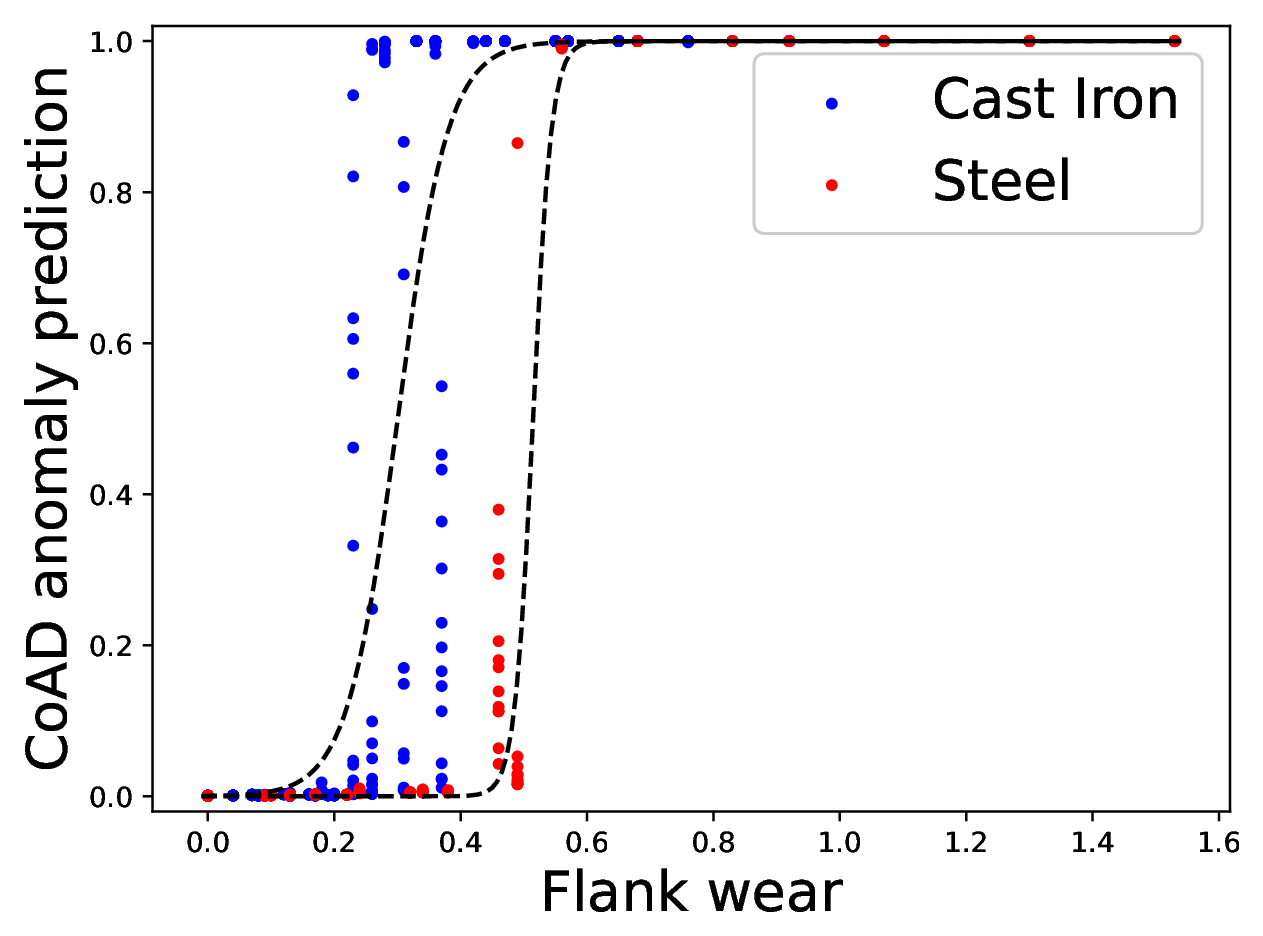
The paper also ran it on a public dataset from UC Berkeley, about 170 metal-milling cuts. The sound and vibration sensors went to one network and the AC and DC currents to the other. The labels come from tool wear. Each quarter-second chunk counts as healthy when the tool's flank is worn less than 0.2 mm and failed past 0.7 mm. CoAD's F1 beat a VAE, DGHL and OmniAnomaly (which all scored about 0.8), and it got every failed chunk right. Unlike the VAE, it didn't have to be trained on healthy cuts only.
It tripped over its own assumption. Worn chunks outnumber healthy ones in this data, and CoAD needs anomalies to be the minority. So the labels flipped, and it learned the healthiest cuts as the class that stands apart.
I like the wear plot best. The networks never saw the wear or the cutting settings. Still, within one setting the score goes from normal to abnormal over a narrow range of wear, and cast iron and steel make the jump at different places. Pooled over all eight settings the link is weak, which says labels drawn from wear alone are too coarse.
Where it stopped
Everything here is offline, on recorded data. At LCLS it is one RF station. The paper's outlook is thousands of subsystems, and it didn't try that. It also needs two inputs that can each see the fault, and not every problem splits that way. The code isn't public. The group later took the idea to RF phase data at LCLS (Liang et al., PRAB 2025), and I'm one of the ten authors on that one.
Numbers and figures are from Humble, Zhang, O'Shea, Darve and Ratner, "Coincident learning for unsupervised anomaly detection of scientific instruments", Mach. Learn.: Sci. Technol. 5, 035036 (2024, open access under CC BY 4.0), first posted as arXiv:2301.11368 in January 2023. The LCLS dataset and the two supervised baselines are from Humble et al., Phys. Rev. Accel. Beams 25, 122804 (2022).