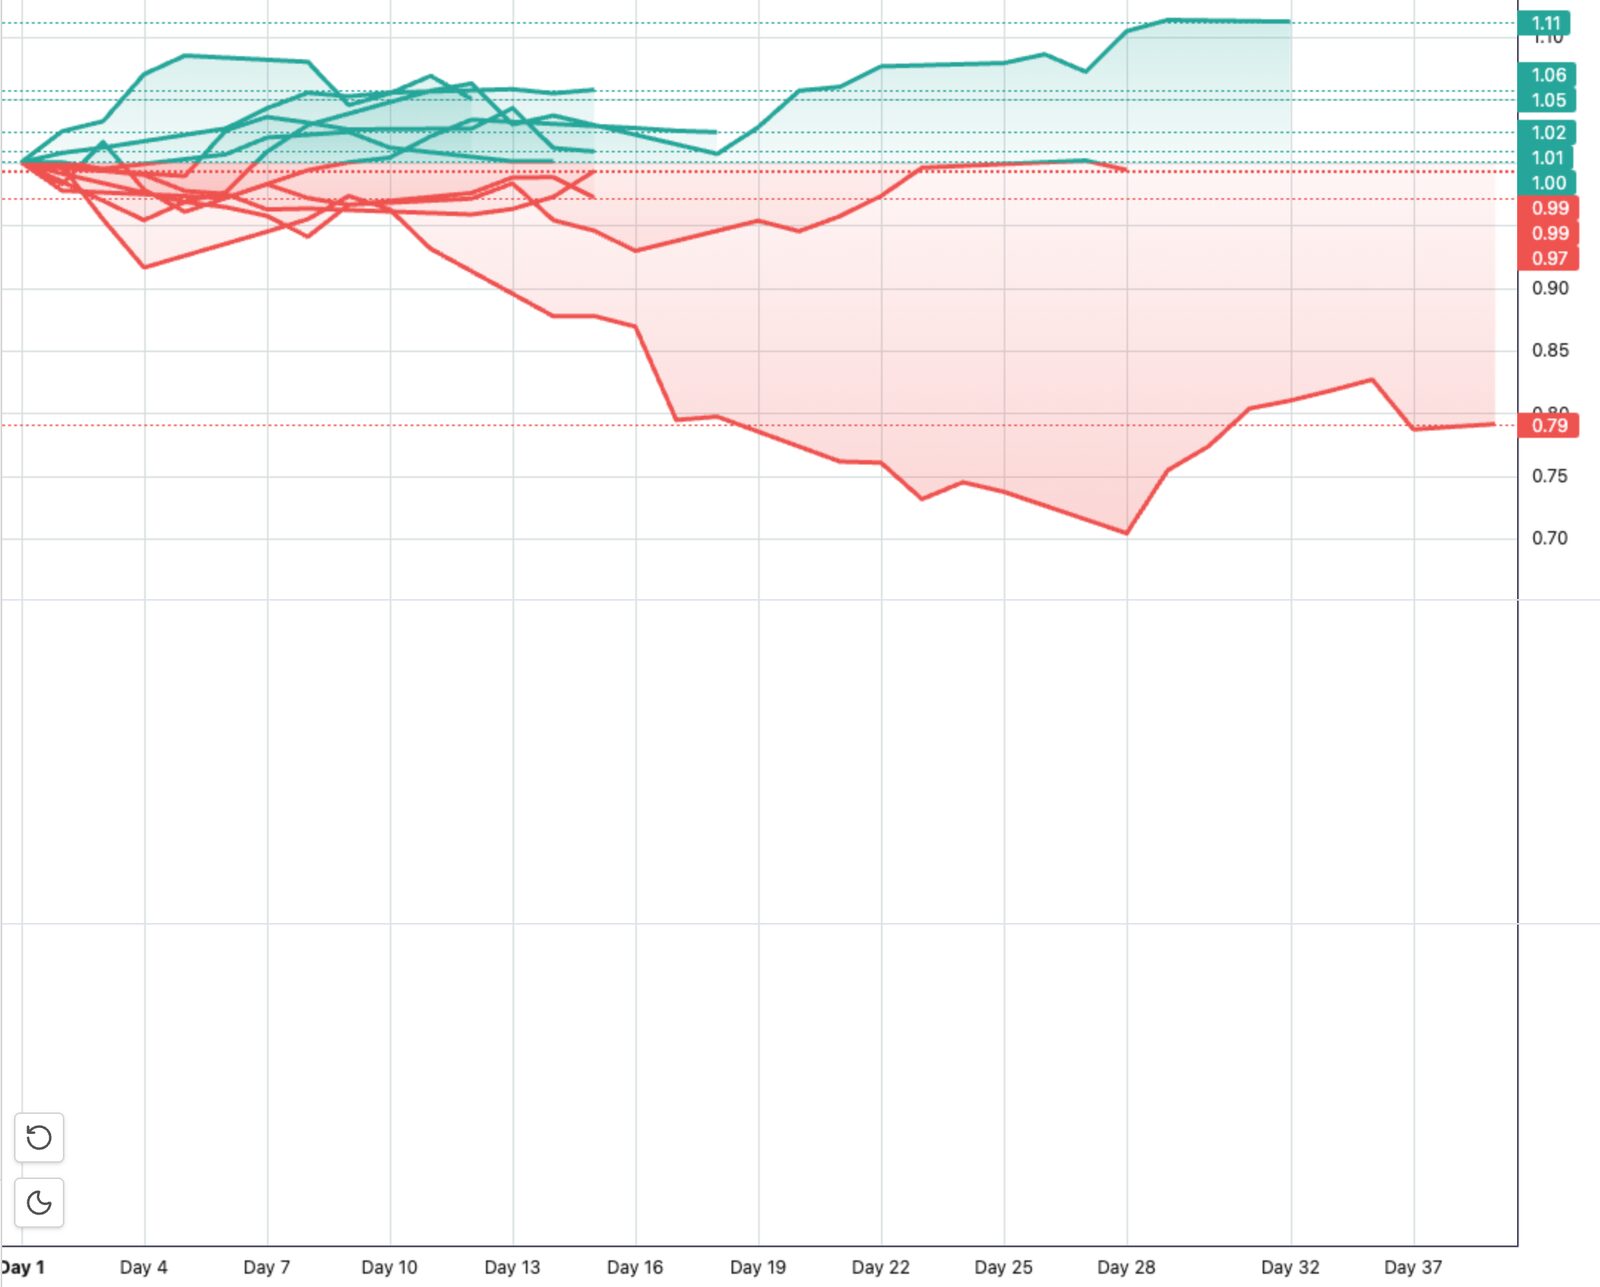
BigWaves Pattern Inspector asks one narrow question: when the Dow has a violent intraday drop, what does a given ticker do over the next thirty days, and do those episodes rhyme? It scans 36 years of Dow Jones daily bars for such days, merges neighbours into events, and lays every aftermath on one chart. It has run on this site since August 2025.
- 1990 → 2026^DJI daily history scanned
- 12+ monthsbackend running continuously
- 30 dayspost-event window, 60-day warm-up
Why
Event studies are usually done once, in a notebook, for one definition of the event. I wanted the definition to be a parameter (how many points; how close two trigger days can be before they count as one) and the comparison visual and immediate, so a hunch about what happens after a crash takes seconds to check.
How
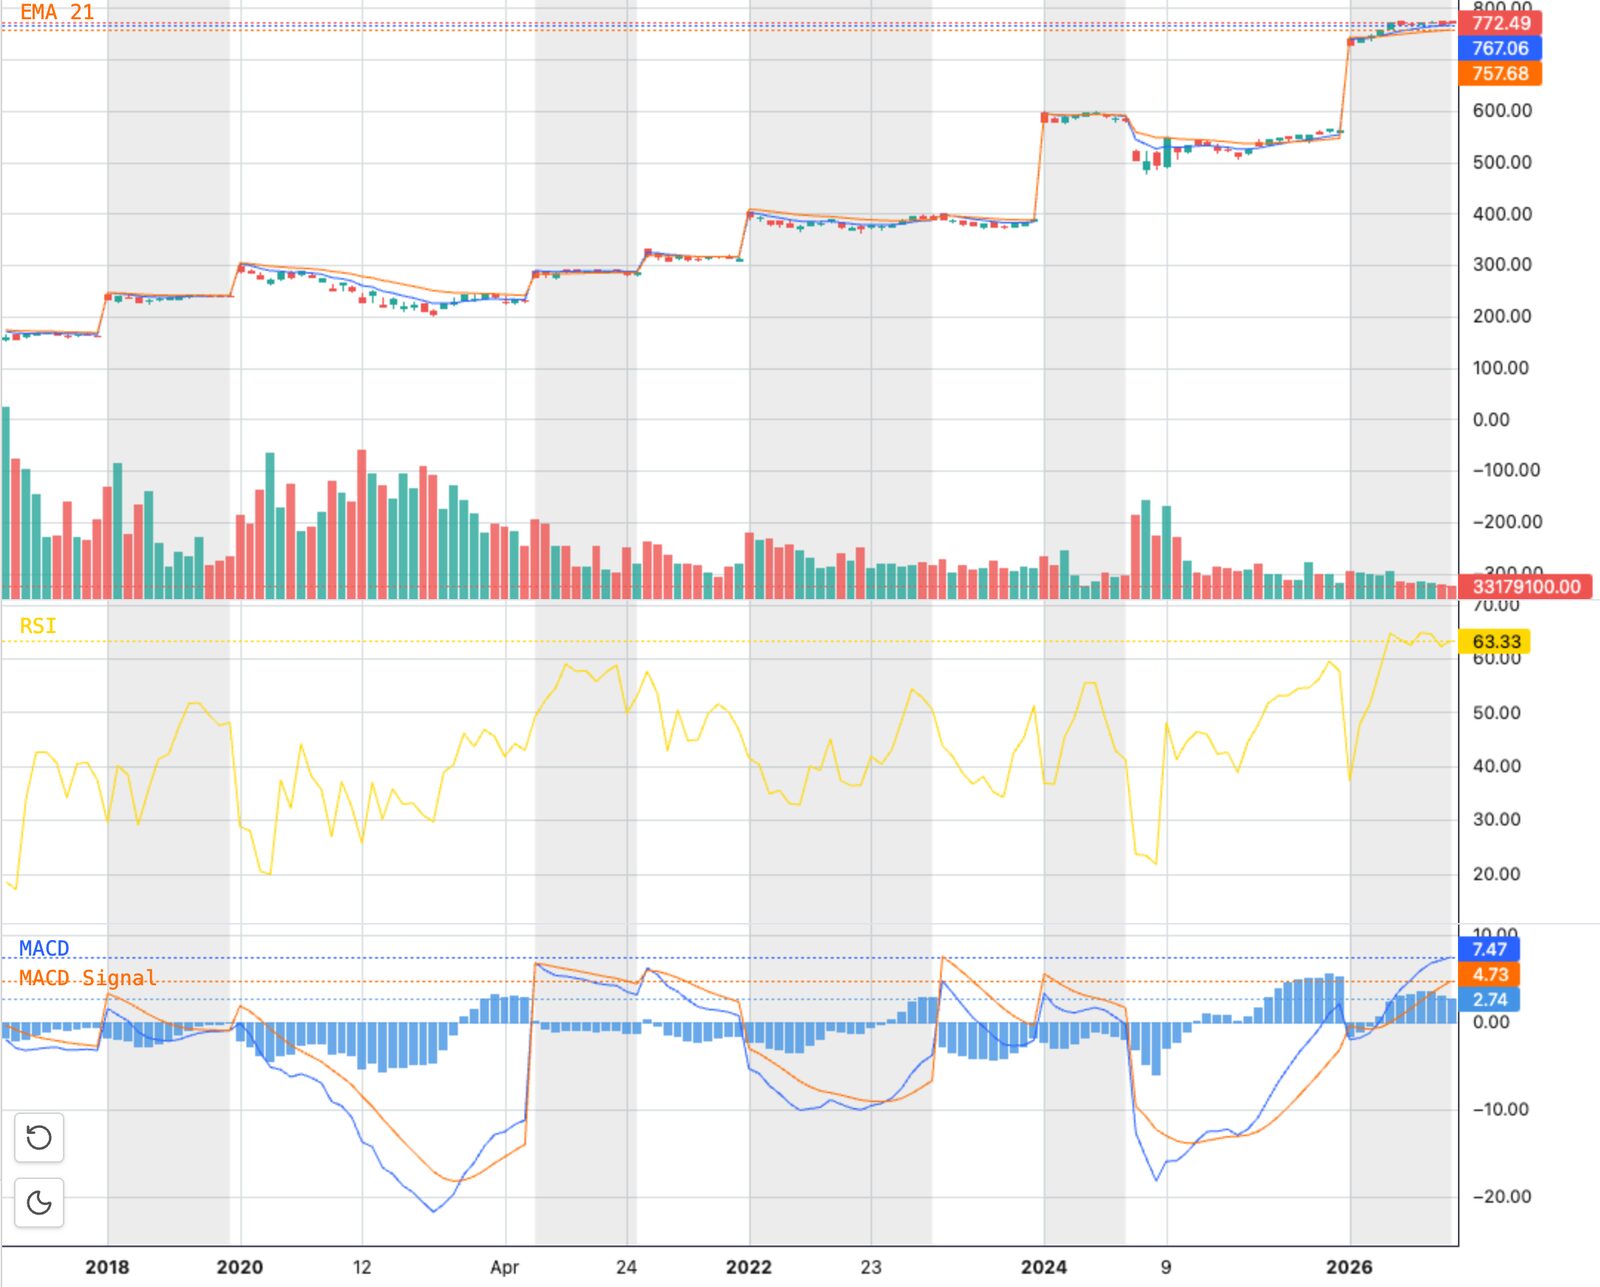
The backend is a small Flask service over pandas, yfinance and TA-Lib. It caches the ^DJI daily series from 1990 and extends it only when a request reaches past the cache. An event is any day where Open − Low exceeds the threshold; trigger days within the merge window collapse into one event dated to the first. For each event it fetches the chosen ticker with a 60-day warm-up, computes EMA 8/21, RSI 14 and MACD, trims to the window and returns JSON for the chart.
The front end is Vue 3 with Tailwind and TradingView's lightweight-charts. Overlay mode aligns every event by day 1, 2, 3 after the trigger so the paths stack; Timeline mode concatenates the windows chronologically, each event shaded.
What it does, and what it does not
It is a looking tool, not a model: it makes conditional paths comparable on a percentage or indexed-to-100 axis before any formal analysis. It also has a flaw. The trigger is a fixed number of index points, and 1,000 Dow points was a far larger move in 2000 than today, so events from different decades are not strictly comparable across the default 2000-to-present window. The right fix is to trigger on log returns normalised by trailing volatility; the point threshold stayed because it is how the question was first asked.
What I did. Wrote the backend end to end (every commit is mine), containerised it with gunicorn behind nginx, and have kept it running for over a year; the Vue front end ships as a static build on the same host.
Live at zhezhang.info/charts. Uptime is the container's age; no usage figures are collected.